The subscription-driven SaaS economy has reshaped how marketing leaders think about performance. In today’s environment, tracking the right B2B SaaS marketing KPIs is critical—growth is no longer a matter of simply filling the pipeline, but of building sustained customer value over time. This is where the LTV-to-CAC ratio becomes the ultimate strategic lever.
Recent academic and industry research reinforces this shift. Curiskis et al. (2024) demonstrate that predictive analytics can accurately forecast Customer Lifetime Value (CLV), enabling marketers to proactively adjust spend and strategy. When paired with disciplined tracking of churn, retention, and Net Revenue Retention (NRR), marketers can prove their influence not just at the point of sale but across the customer lifecycle.[1]
From Acquisition to Lifetime Value
Return on Investment (ROI)
Return on Investment (ROI) is one of the most fundamental B2B SaaS marketing metrics, helping companies measure how effectively their marketing spend generates revenue.
Formula: ROI = (Marketing Revenue – Marketing Costs) ÷ Marketing Costs × 100
Tips to optimise ROI:
Track ROI by channel for precise budget allocation.
Apply B2B SaaS marketing data analysis to connect revenue to campaigns.
Test and iterate creatives to improve conversion.
Customer Acquisition Cost (CAC)
Customer Acquisition Cost (CAC) is a core key performance indicator for B2B SaaS.
Formula: CAC = Total Sales & Marketing Costs ÷ New Customers
Optimisation strategies:
-
Pair CAC with LTV for sustainability.
-
Refine targeting to improve lead quality.
-
Automate processes to reduce cost per acquisition.
Why the LTV-to-CAC Ratio Matters
The LTV-to-CAC ratio is the single most integrative KPI for SaaS marketers , blending acquisition cost efficiency with retention success. Industry norms suggest a 3:1 ratio as healthy, while predictive CLV modelling from Curiskis et al. can push this figure higher by helping teams anticipate churn and upsell potential before it’s reflected in revenue reports.[1]
For example:
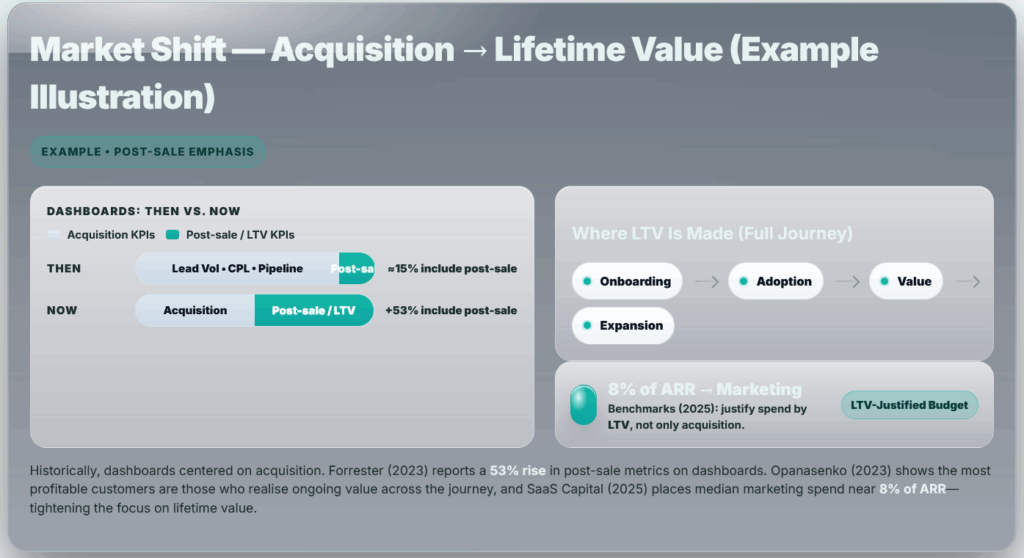
Median marketing spend: 8 % of ARR.
Post-sale focus: 53 % of CMOs now track retention and expansion KPIs (Forrester, 2023).[2]
Expansion revenue impact: Expansion accounts for ~35 % of ARR in mature SaaS models.
The key takeaway: CAC is static in the short term, but LTV is elastic — and marketing is the function best positioned to stretch it.
Lifetime Value-to-Customer Acquisition Cost Ratio
A critical B2B SaaS KPI best practice is monitoring the LTV:CAC ratio.
Best practices:
Increase retention through lifecycle marketing.
Use predictive analytics to identify upsell opportunities.
Annual Churn
Annual churn is a key metric for tracking B2B SaaS marketing success.
Formula: Annual Churn = (Customers Lost ÷ Customers at Start of Year) × 100
Ways to reduce churn:
Introduce customer success programs.
Personalise retention offers based on engagement signals.
Aligning Marketing to Lifetime Value
To operationalise LTV focus, we can merge practitioner insight with research-backed methods:
Predictive CLV Forecasting
Adopt models like those in Curiskis et al. to forecast LTV per account. Use RMSE and SMAPE to evaluate accuracy and feed outputs into campaign planning.[1]Behavioral Segmentation for Retention
From Michel & Alejandro (2024), build segments using product usage and interaction patterns. Marketing then develops segment-specific lifecycle plays, e.g., feature adoption campaigns for low-engagement cohorts. [4]Monthly LTV-to-CAC Tracking
Embed ratio tracking into dashboards alongside churn and NRR. This ensures marketing has early warning when value erosion threatens.[3]
Journey-Aligned Messaging
Following Opanasenko, tie content offers and upsell prompts to specific journey milestones, ensuring marketing spend accelerates progression through the lifecycle.
Lead-to-MQL Conversion Rate
A foundational key performance indicator for B2B SaaS.
Formula: Lead-to-MQL Conversion Rate = (MQLs ÷ Leads) × 100
Improvement tips:
Behavioural scoring in CRM.
Segment-based content strategies.
Embedding Post-Sale Metrics in ROI
Embedding post-sale KPIs transforms marketing’s perceived value. From Skok’s “SaaS metrics 2.0”, we know churn and retention are not just health checks , they are revenue levers.
Key integrations:
Churn Rate: Even a 2 % monthly reduction compounds to significant ARR preservation.
NRR > 100 %: Indicates expansion is outpacing churn.
Customer Health Scores: Combine behavioral, usage, and support ticket data for predictive churn modelling.
Michel & Alejandro’s segmentation research shows that marketing and Customer Success collaboration here is critical, CS manages the relationship, but marketing’s lifecycle campaigns drive expansion readiness.
Visitor-to-Lead Conversion Rate
Part of B2B SaaS marketing metrics, this measures website efficiency.
Formula: (Leads ÷ Visitors) × 100
Best practices:
Strong CTAs and tailored landing pages.
Unique Monthly Visitors
A top-of-funnel indicator in B2B SaaS marketing data analysis.
Growth tactics:
SEO for organic reach.
Partnerships with industry leaders.
Shifting Away from Sourcing Metrics
- Deprioritise pure “marketing-sourced” pipeline as the success story.
- Elevate lifecycle metrics into board reporting.
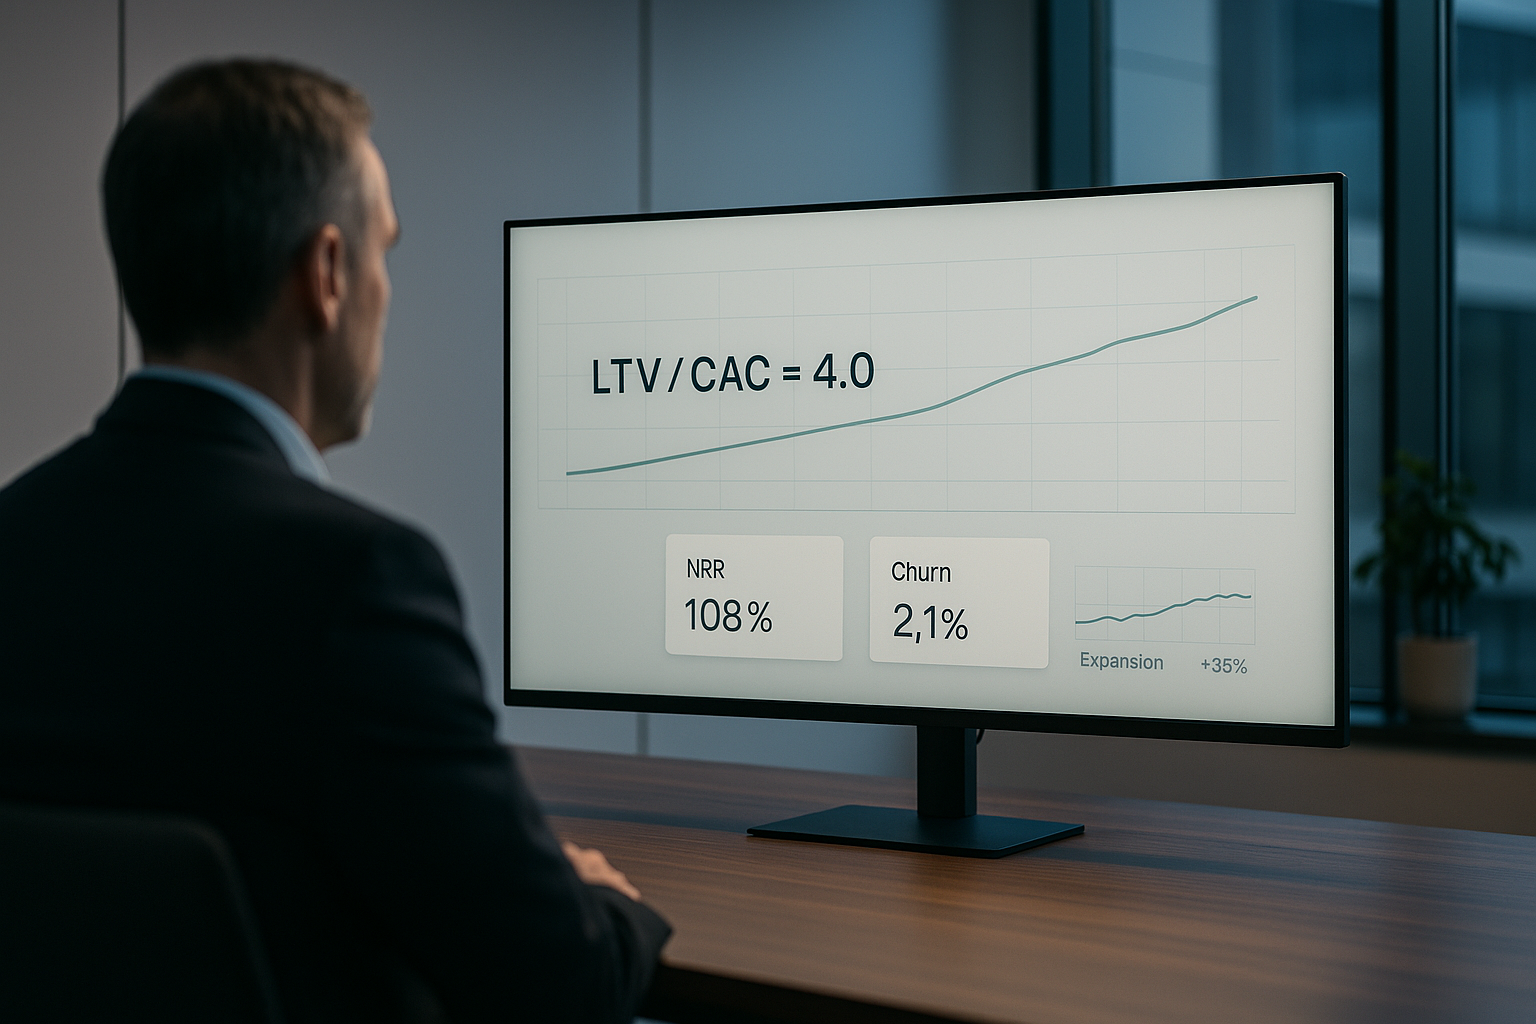
Case-in-Point: Budget Discipline and Growth ROI
Consider a mid-market SaaS with $50M ARR and $4M in marketing spend (8 % of ARR). Without predictive CLV and segmentation, LTV-to-CAC sits at 2:1, limiting profitable growth. By implementing predictive analytics (Curiskis), segment-specific retention campaigns (Michel & Alejandro), and journey-timed upsells (Opanasenko), the ratio climbs to 4:1 within a fiscal year.
That improvement translates into $100M+ in lifetime value without increasing spend — a transformation that strengthens both operational performance and investor appeal (Stodt).
Conclusion
The research is conclusive: the winning SaaS marketing strategy is metrics-driven, lifecycle-focused, and predictive. By integrating CLV forecasting, behavioral segmentation, and journey-aligned campaigns, marketing moves from lead generator to profit accelerator.
With investor scrutiny rising and budgets capped, the question for CMOs isn’t whether to shift focus, but how quickly they can realign KPIs to reflect post-sale value creation.
FAQ: Common Questions on B2B SaaS Marketing KPIs
What is a healthy LTV-to-CAC ratio in B2B SaaS marketing?
A ratio of at least 3:1 is considered healthy, ensuring that customer lifetime value significantly outweighs acquisition cost.Why should B2B SaaS marketers include Churn and NRR in their KPI dashboards?
Churn directly reduces LTV, while Net Revenue Retention reflects expansion revenue—both are critical to maximizing return on marketing investment.How does shifting focus from marketing-sourced pipeline to post-sale metrics affect performance evaluation?
It aligns marketing with long-term business value rather than just acquisition, fostering cross-functional ownership of customer success and profitability.What role does marketing spend as % of ARR play in KPI strategy?
Keeping marketing spend around the benchmark (8 % of ARR) ensures fiscal discipline; maximizing LTV-to-CAC within that budget drives effective growth.
References
- Predictive Analytics & Customer Lifetime Value – researchgate.net
- State of B2B Marketing Measurement (2023) – forrester.com
- SaaS Customer Journey Mapping – researchgate.net
- Behavioral Segmentation for SaaS Marketing – researchgate.net